Network monitoring built for real sites, real devices, and real operations.
Xerixos - Network Management Platform gives MSPs, schools, churches, and businesses a clear view of site health, device status, latency, uptime, and local network checks from one clean dashboard.
Free forever for basic monitoring. Upgrade only when you need deeper device visibility.
Everything you need to see what is happening on your network.
Start monitoring without a sales call, contract, or credit card.
Every Xerixos account can begin with basic network management for free. That means a school, business, church, or MSP can start checking core connectivity right away. If basic visibility is all you need, you can keep using it free for life within published plan limits.
Free monitoring includes
- Basic site connectivity checks
- Dashboard access
- Agent deployment
- Online/offline visibility
- Last 24-hour connectivity overview
Upgrade when you need more
- Add monitored network devices
- Use SNMP, TCP, and ping checks
- View device-level health
- Track interfaces, VLANs, and neighbors where supported
- Expand monitored-device limits
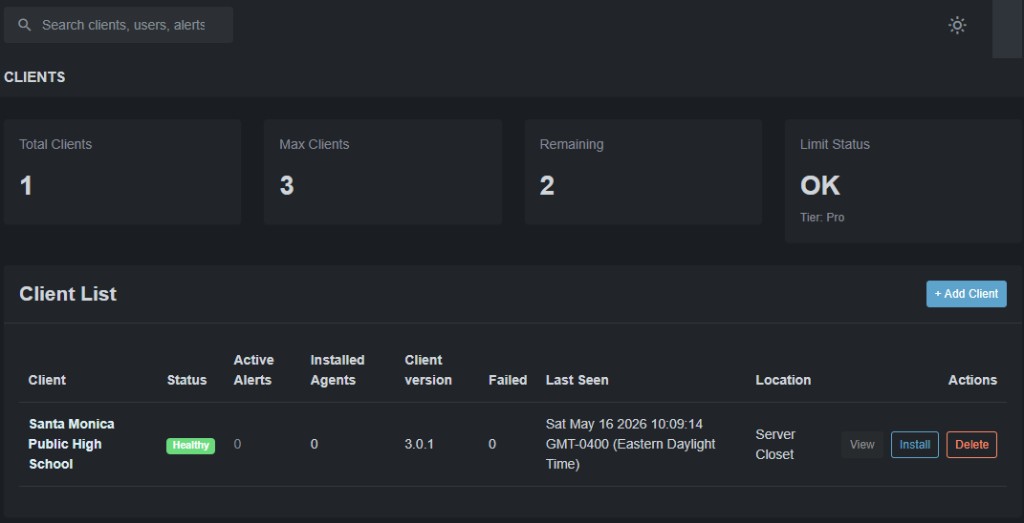
See the health of every site at a glance.
The dashboard gives teams a fast operational view of site status, recent connectivity, latency, uptime, and monitored devices. Instead of waiting for someone to report an issue, Xerixos helps you see problems as they develop.
Go deeper with device-level monitoring.
When basic site monitoring is not enough, Xerixos can monitor individual network devices using ping, TCP, and SNMP. This gives administrators and MSPs a clearer view of switches, firewalls, access points, printers, and other critical infrastructure.
Ping checks
Availability for critical hosts and appliances.
TCP checks
Service reachability on specific ports.
SNMP checks
Supported metrics where devices expose SNMP.
Per-device health
Status, last check, and failure context.
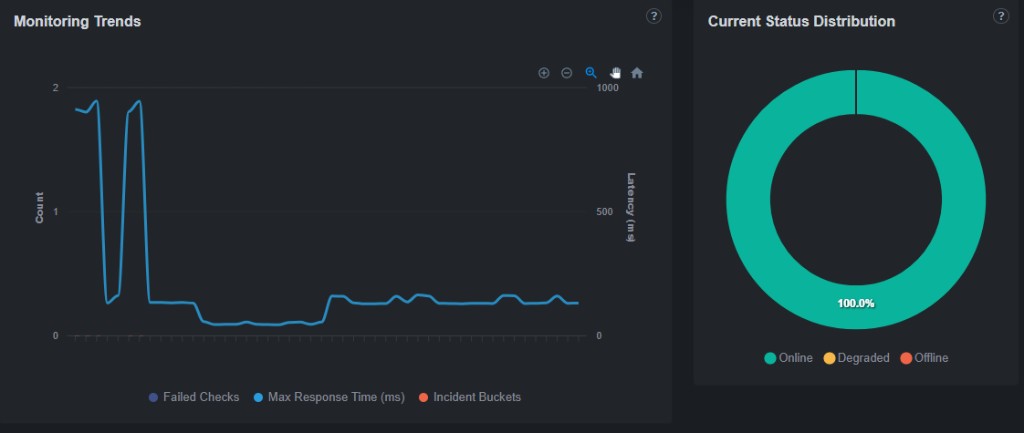
Response history
Latency trends over time.
Failure details
See what failed and when it recovered.
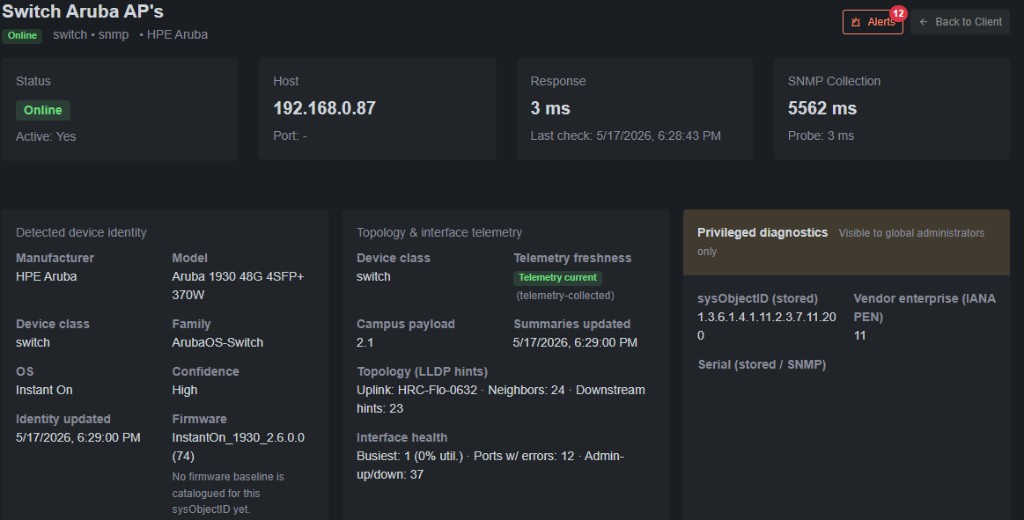
Understand what is happening inside supported network devices.
For supported devices, SNMP visibility can show useful operational details such as interfaces, VLANs, neighbors, system information, and health data. This helps teams troubleshoot network problems faster without logging into every device individually. Availability depends on device vendor, model, and SNMP configuration.
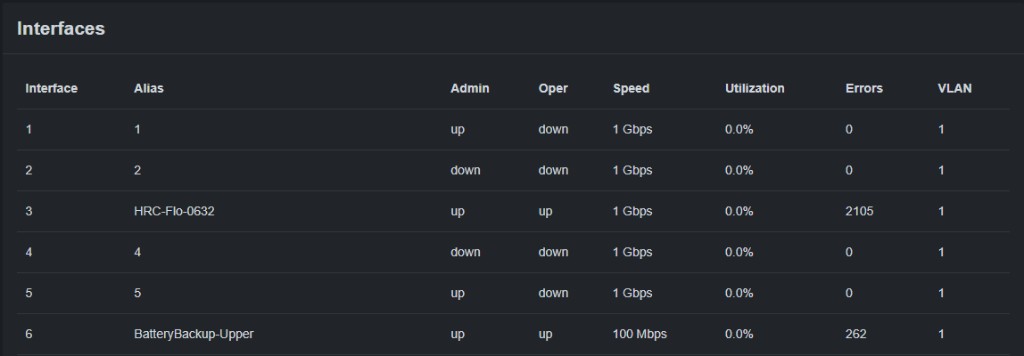
Interface status
Admin/oper state, speed, and errors where exposed.
VLAN information
Port assignments when reported by the device.
Neighbor discovery
LLDP hints and topology context where available.
Device identity
Vendor, model, and firmware when discoverable.
Health metrics
CPU and memory data where the device provides it.
Port context
Switch port maps and interface tables on supported gear.
Monitor from inside the network.
Xerixos agents run from inside the client or school network, allowing checks to be performed locally instead of relying only on outside-in monitoring. This gives a more accurate picture of what users at the site are experiencing.
Lightweight deployment
Windows agent install per site.
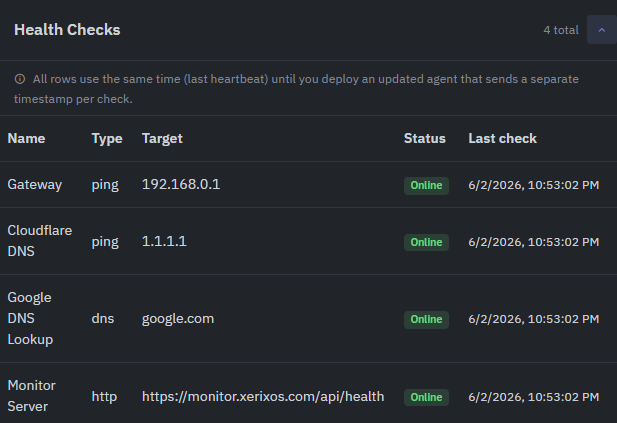
Local network checks
Gateway, DNS, and connectivity from the LAN.
Site-specific monitoring
Health tied to each location you manage.
Agent check-in visibility
Version, last seen, and update status.
Internal reachability
See device and path issues from inside.
Better troubleshooting
Context that cloud-only pings cannot provide.
Built for the environments technology teams actually support.
Xerixos is built for real-world environments where teams need fast visibility without unnecessary complexity. It is especially useful for MSPs, schools, churches, and multi-site organizations that need to monitor client networks, classrooms, offices, and infrastructure from one place.
For MSPs
- Monitor multiple client sites
- Separate client dashboards
- Quickly identify outages
- Reduce unnecessary onsite troubleshooting
- Improve support response time
For schools
- Monitor core network health
- Track important devices
- See issues before instruction is disrupted
- Keep technology teams informed
- Start with free basic monitoring
For businesses & churches
- Monitor offices, facilities, and shared spaces
- Keep visibility over key infrastructure
- Track connectivity and device health
- Reduce downtime surprises
- Upgrade only when deeper visibility is needed
Simple to run day to day.
Xerixos is built for teams who need clear network visibility—not a pile of platform administration screens. Manage sites, see agent health, respond to alerts, and upgrade when your environment needs more.
Start monitoring your first site today.
Create a free account and begin monitoring basic network connectivity right away. Upgrade later only when you need deeper device visibility.